FFT Charter with Filmstrip
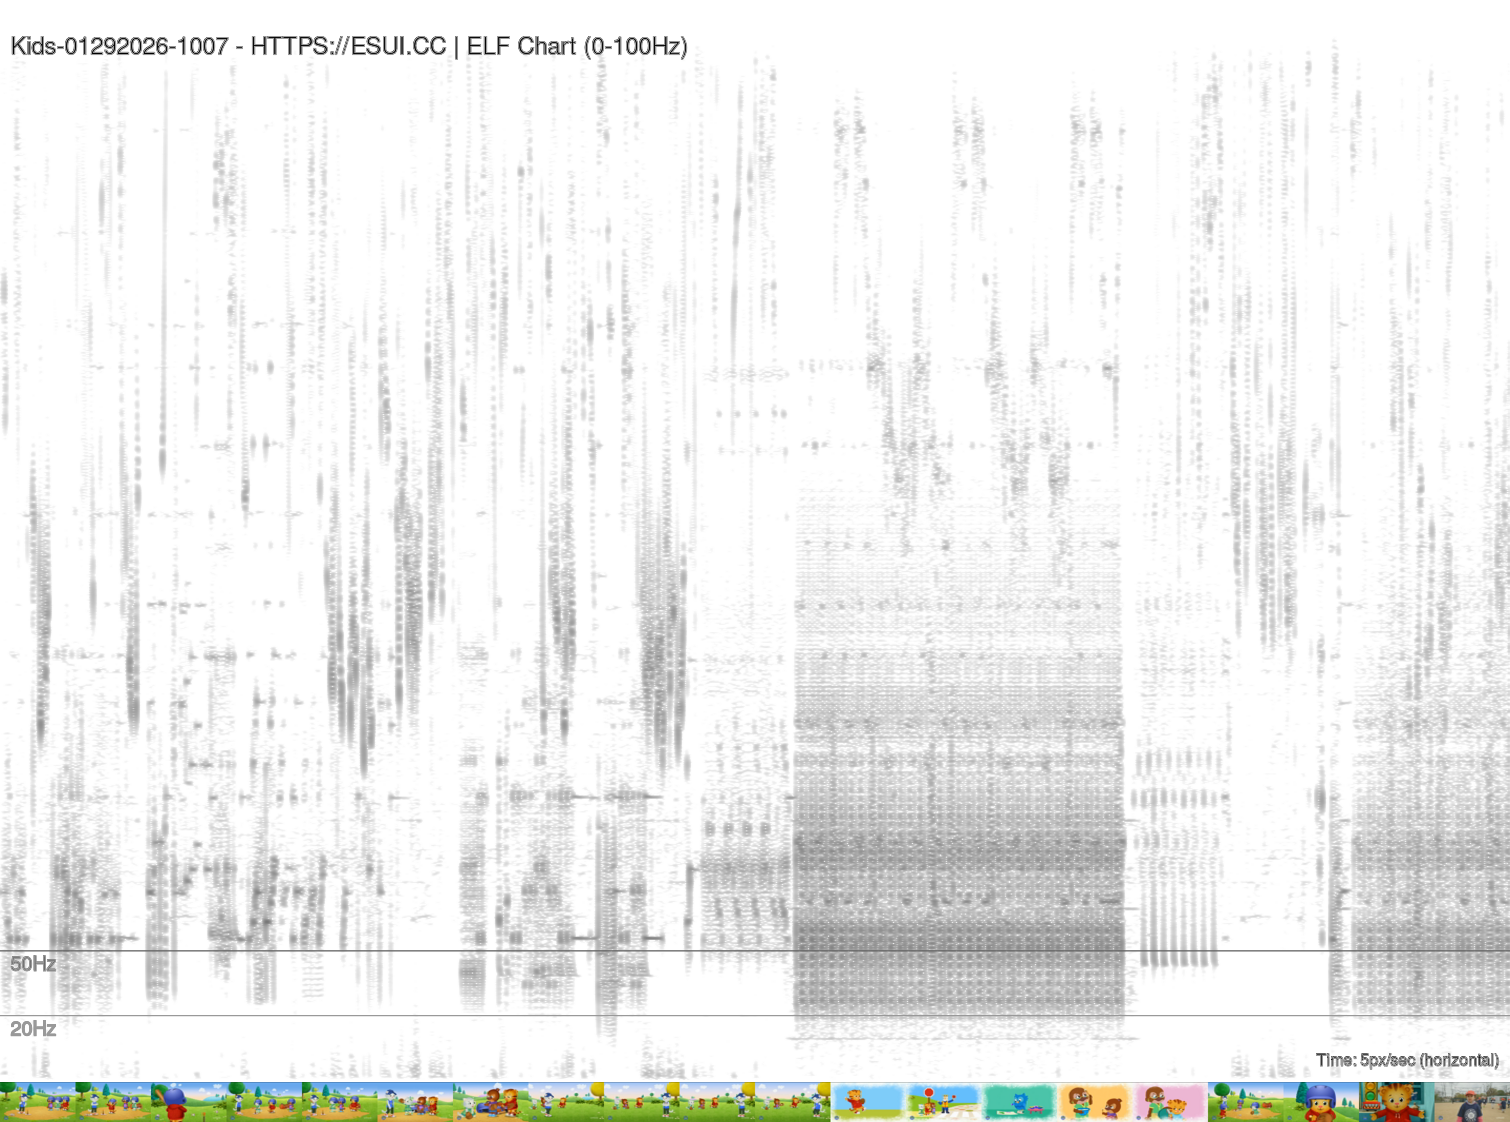
Uses SoX, ffmpeg, ImageMagick and GNUPlot. Charts 5 pixels per second at 1080px height FFT below the 100hz with markers at 50hz and 20hz along with source filmstrip at exact marker for visual context to infrasound artifacts.
SH
elf_chart.sh
#!/bin/bash
#
# ELF (Extremely Low Frequency) Chart Generator
# Generates pure black-on-white spectrogram for frequencies 100Hz and below
# from MTS, MP4, and WAV files using SoX and ImageMagick
# Output: Black = high magnitude, White = low magnitude
# Orientation: Time axis = horizontal, Frequency axis = vertical
#

set -e

# Configuration
OUTPUT_HEIGHT=1080
PIXELS_PER_SECOND=5
MAX_FREQ=100
SAMPLE_RATE=1000  # 1kHz gives Nyquist of 500Hz; 0-100Hz is 20% of display
MAX_OUTPUT_WIDTH=8000  # Maximum final image width (avoids ImageMagick policy limits)

# Colors for pure black-on-white output
# Magnitude shown as black intensity (black = high, white = low)
BG_COLOR="white"
FG_COLOR="black"

# Temporary directory
TMPDIR=$(mktemp -d)
trap "rm -rf $TMPDIR" EXIT

# Check dependencies
for cmd in sox ffmpeg gnuplot; do
    if ! command -v "$cmd" &> /dev/null; then
        echo "Error: $cmd is required but not installed."
        exit 1
    fi
done

# Find all media files (nocaseglob handles case-insensitivity)
shopt -s nullglob nocaseglob
FILES=(*.mts *.mp4 *.wav)
shopt -u nullglob nocaseglob

if [ ${#FILES[@]} -eq 0 ]; then
    echo "No MTS, MP4, or WAV files found in current directory."
    exit 1
fi

echo "Found ${#FILES[@]} media file(s) to process..."

for FILE in "${FILES[@]}"; do
    echo "Processing: $FILE"

    BASENAME=$(basename "$FILE")
    NAME="${BASENAME%.*}"
    EXT="${BASENAME##*.}"
    EXT_LOWER=$(echo "$EXT" | tr '[:upper:]' '[:lower:]')

    WAV_FILE="$TMPDIR/${NAME}_temp.wav"
    RESAMPLED_FILE="$TMPDIR/${NAME}_resampled.wav"
    SPECTRUM_FILE="$TMPDIR/${NAME}_spectrum.dat"
    OUTPUT_FILE="${NAME}_elf_chart.png"

    # Step 1: Extract/convert audio to WAV
    echo "  Extracting audio..."
    if [ "$EXT_LOWER" = "wav" ]; then
        cp "$FILE" "$WAV_FILE"
    else
        ffmpeg -y -i "$FILE" -vn -acodec pcm_s16le -ar 44100 -ac 1 "$WAV_FILE" 2>/dev/null
    fi

    # Step 2: Resample to low sample rate and apply low-pass filter for ELF
    echo "  Filtering for ELF frequencies (0-${MAX_FREQ}Hz)..."
    sox "$WAV_FILE" -r $SAMPLE_RATE "$RESAMPLED_FILE" lowpass $MAX_FREQ

    # Step 3: Get audio duration
    DURATION=$(sox "$RESAMPLED_FILE" -n stat 2>&1 | grep "Length" | awk '{print $3}')
    DURATION_INT=${DURATION%.*}
    if [ -z "$DURATION_INT" ] || [ "$DURATION_INT" -eq 0 ]; then
        DURATION_INT=1
    fi

    # Calculate output width based on duration
    # Ensure width > height for landscape orientation (time = horizontal axis)
    EFFECTIVE_PPS=$PIXELS_PER_SECOND
    OUTPUT_WIDTH=$((DURATION_INT * EFFECTIVE_PPS))

    # Cap width to avoid ImageMagick policy limits
    if [ "$OUTPUT_WIDTH" -gt "$MAX_OUTPUT_WIDTH" ]; then
        EFFECTIVE_PPS=$(echo "scale=4; $MAX_OUTPUT_WIDTH / $DURATION_INT" | bc)
        OUTPUT_WIDTH=$MAX_OUTPUT_WIDTH
        echo "  Long video detected - reducing resolution to ${EFFECTIVE_PPS} px/sec"
    fi

    MIN_WIDTH=$((OUTPUT_HEIGHT + 100))  # Ensure landscape: width > height
    if [ "$OUTPUT_WIDTH" -lt "$MIN_WIDTH" ]; then
        OUTPUT_WIDTH=$MIN_WIDTH
    fi

    echo "  Duration: ${DURATION_INT}s, Output size: ${OUTPUT_WIDTH}x${OUTPUT_HEIGHT}px"

    # Step 4: Generate spectrogram data using SoX
    echo "  Generating spectrogram with SoX..."
    SPEC_PNG="$TMPDIR/${NAME}_sox_spec.png"
    SPEC_BW="$TMPDIR/${NAME}_sox_spec_bw.png"

    # SoX spectrogram: generate full image at target dimensions (no cropping)
    # Use -m for monochrome, -l for light background
    SPEC_RAW="$TMPDIR/${NAME}_sox_raw.png"

    # Generate spectrogram directly at output dimensions
    # -r = raw (no axes) so filmstrip aligns properly; we add our own labels
    sox "$RESAMPLED_FILE" -n spectrogram \
        -x "$OUTPUT_WIDTH" \
        -Y "$OUTPUT_HEIGHT" \
        -z 80 \
        -m -l -r \
        -o "$SPEC_RAW" 2>/dev/null || true

    # Verify spectrogram was created
    if [ ! -f "$SPEC_RAW" ] || [ ! -s "$SPEC_RAW" ]; then
        echo "  Error: SoX failed to generate spectrogram for $FILE"
        echo "  Skipping this file..."
        continue
    fi

    # Resize spectrogram to exact dimensions (removes any SoX padding)
    mogrify -limit memory 2GiB -limit map 4GiB -limit disk 8GiB \
        -resize "${OUTPUT_WIDTH}x${OUTPUT_HEIGHT}!" "$SPEC_RAW"

    # Copy raw spectrogram for further processing
    cp "$SPEC_RAW" "$SPEC_PNG"


    # Step 5: Create the final chart with gnuplot overlaying frequency lines
    echo "  Adding frequency markers with gnuplot..."

    # Calculate Y positions for frequency lines (spectrogram shows 0 to Nyquist)
    # Nyquist = SAMPLE_RATE / 2 = 500 Hz
    # Add 10 Hz offset to correct for spectrogram frequency alignment
    NYQUIST=$((SAMPLE_RATE / 2))
    FREQ_OFFSET=10
    # Y position = (frequency / nyquist) * height (from bottom)
    LINE_50HZ_Y=$(echo "scale=2; ((50 + $FREQ_OFFSET) / $NYQUIST) * $OUTPUT_HEIGHT" | bc)
    LINE_20HZ_Y=$(echo "scale=2; ((20 + $FREQ_OFFSET) / $NYQUIST) * $OUTPUT_HEIGHT" | bc)

    # Invert Y because image coordinates start from top
    LINE_50HZ_Y_INV=$(echo "scale=2; $OUTPUT_HEIGHT - $LINE_50HZ_Y" | bc)
    LINE_20HZ_Y_INV=$(echo "scale=2; $OUTPUT_HEIGHT - $LINE_20HZ_Y" | bc)

    gnuplot <<EOF
set terminal pngcairo size $OUTPUT_WIDTH,$OUTPUT_HEIGHT background '$BG_COLOR'
set output '$OUTPUT_FILE'

# Remove margins and axes for clean overlay
unset border
unset tics
unset key
set lmargin at screen 0
set rmargin at screen 1
set tmargin at screen 1
set bmargin at screen 0

# Set coordinate system to match image pixels
set xrange [0:$OUTPUT_WIDTH]
set yrange [0:$OUTPUT_HEIGHT]

# Plot the spectrogram as background (gray lines for B/W output)
plot '$SPEC_PNG' binary filetype=png with rgbimage, \
     $LINE_50HZ_Y_INV notitle with lines lc rgb "gray40" lw 2 dt 2, \
     $LINE_20HZ_Y_INV notitle with lines lc rgb "gray60" lw 2 dt 2
EOF

    # Since gnuplot binary image loading can be tricky, use alternative approach
    # Create a labeled version using ImageMagick if available, or pure gnuplot

    if command -v convert &> /dev/null; then
        echo "  Adding labels with ImageMagick..."
        convert -limit memory 2GiB -limit map 4GiB -limit disk 8GiB \
            "$SPEC_PNG" \
            -fill "gray40" -stroke "gray40" -strokewidth 1 \
            -draw "line 0,$LINE_50HZ_Y_INV $OUTPUT_WIDTH,$LINE_50HZ_Y_INV" \
            -fill "gray60" -stroke "gray60" -strokewidth 1 \
            -draw "line 0,$LINE_20HZ_Y_INV $OUTPUT_WIDTH,$LINE_20HZ_Y_INV" \
            -fill "gray40" -pointsize 20 -gravity NorthWest \
            -annotate +10+$LINE_50HZ_Y_INV "50Hz" \
            -fill "gray60" -pointsize 20 -gravity NorthWest \
            -annotate +10+$LINE_20HZ_Y_INV "20Hz" \
            -fill "$FG_COLOR" -pointsize 24 -gravity NorthWest \
            -annotate +10+30 "$NAME - HTTPS://ESUI.CC | ELF Chart (0-${MAX_FREQ}Hz)" \
            -fill "$FG_COLOR" -pointsize 16 -gravity SouthEast \
            -annotate +10+10 "Time: ${EFFECTIVE_PPS}px/sec (horizontal)" \
            "$OUTPUT_FILE"
    else
        # Fallback: use gnuplot to create chart with labels
        echo "  Creating labeled chart with gnuplot..."

        gnuplot <<GNUPLOT_SCRIPT
set terminal pngcairo size $OUTPUT_WIDTH,$OUTPUT_HEIGHT enhanced font 'Arial,14' background '$BG_COLOR'
set output '$OUTPUT_FILE'

# Remove default decorations
unset border
unset tics
unset key

# Full canvas
set lmargin at screen 0.0
set rmargin at screen 1.0
set tmargin at screen 1.0
set bmargin at screen 0.0

set xrange [0:$OUTPUT_WIDTH]
set yrange [0:$OUTPUT_HEIGHT]

# Title and scale info as labels
set label 1 "$NAME - ELF Chart (0-${MAX_FREQ}Hz)" at 10,($OUTPUT_HEIGHT-30) left font ',18' tc rgb "$FG_COLOR"
set label 2 "Time: ${EFFECTIVE_PPS}px/sec (horizontal)" at ($OUTPUT_WIDTH-10),20 right font ',12' tc rgb "$FG_COLOR"

# Frequency line labels (gray for B/W output)
set label 3 "50Hz" at 50,$LINE_50HZ_Y_INV left font ',16' tc rgb "gray40"
set label 4 "20Hz" at 50,$LINE_20HZ_Y_INV left font ',16' tc rgb "gray60"

# Draw horizontal lines at 50Hz and 20Hz (gray for B/W output)
set arrow 1 from 0,$LINE_50HZ_Y_INV to $OUTPUT_WIDTH,$LINE_50HZ_Y_INV nohead lc rgb "gray40" lw 2 dt 2
set arrow 2 from 0,$LINE_20HZ_Y_INV to $OUTPUT_WIDTH,$LINE_20HZ_Y_INV nohead lc rgb "gray60" lw 2 dt 2

# Plot the spectrogram image
plot '$SPEC_PNG' binary filetype=png with rgbimage notitle
GNUPLOT_SCRIPT
    fi

    # Verify output was created, if not copy sox spectrogram
    if [ ! -f "$OUTPUT_FILE" ]; then
        echo "  Warning: gnuplot output failed, using SoX spectrogram directly"
        cp "$SPEC_PNG" "$OUTPUT_FILE"
    fi

    # Step 6: Add video stills filmstrip below the chart (skip for WAV files)
    if [ "$EXT_LOWER" != "wav" ]; then
        echo "  Extracting video stills for filmstrip..."

        THUMB_WIDTH=72          # 720/10 - width of each thumbnail
        THUMB_INTERVAL_PX=72    # pixels between each still start
        THUMB_INTERVAL_SEC=$(echo "scale=2; $THUMB_INTERVAL_PX / $EFFECTIVE_PPS" | bc)

        # Calculate thumbnail height (maintain 16:9 aspect from 720/2 source width)
        THUMB_HEIGHT=$((THUMB_WIDTH * 9 / 16))

        FILMSTRIP="$TMPDIR/${NAME}_filmstrip.png"
        THUMB_DIR="$TMPDIR/${NAME}_thumbs"
        mkdir -p "$THUMB_DIR"

        # Extract frames at intervals
        ffmpeg -y -i "$FILE" -vf "fps=1/$THUMB_INTERVAL_SEC,scale=$THUMB_WIDTH:$THUMB_HEIGHT" \
            "$THUMB_DIR/thumb_%04d.png" 2>/dev/null

        # Count how many thumbnails we need to match chart width
        NUM_THUMBS=$((OUTPUT_WIDTH / THUMB_WIDTH))

        # Build filmstrip by appending thumbnails horizontally
        THUMB_FILES=("$THUMB_DIR"/thumb_*.png)
        if [ ${#THUMB_FILES[@]} -gt 0 ]; then
            # Limit to number needed and pad if necessary
            FILMSTRIP_THUMBS=()
            for ((i=0; i<NUM_THUMBS; i++)); do
                if [ $i -lt ${#THUMB_FILES[@]} ]; then
                    FILMSTRIP_THUMBS+=("${THUMB_FILES[$i]}")
                else
                    # Pad with last available thumbnail
                    FILMSTRIP_THUMBS+=("${THUMB_FILES[-1]}")
                fi
            done

            # Create filmstrip
            convert -limit memory 2GiB -limit map 4GiB -limit disk 8GiB \
                "${FILMSTRIP_THUMBS[@]}" +append "$FILMSTRIP"

            # Resize filmstrip to exact chart width
            mogrify -limit memory 2GiB -limit map 4GiB -limit disk 8GiB \
                -resize "${OUTPUT_WIDTH}x${THUMB_HEIGHT}!" "$FILMSTRIP"

            # Create a spacer to separate chart from filmstrip
            SPACER_HEIGHT=2
            SPACER="$TMPDIR/${NAME}_spacer.png"
            convert -size "${OUTPUT_WIDTH}x${SPACER_HEIGHT}" xc:white "$SPACER"

            # Append spacer and filmstrip below chart
            convert -limit memory 2GiB -limit map 4GiB -limit disk 8GiB \
                "$OUTPUT_FILE" "$SPACER" "$FILMSTRIP" -append "$OUTPUT_FILE"

            echo "  Added filmstrip: ${#FILMSTRIP_THUMBS[@]} stills at ${THUMB_INTERVAL_SEC}s intervals"
        fi
    fi

    echo "  Output: $OUTPUT_FILE"
done

echo ""
echo "Done! Generated ELF charts for ${#FILES[@]} file(s)."